This article describes how to implement non-visual-totals with security roles in Power BI and Analysis Services Tabular, which by default show only visual totals of measures in the model.
In Power BI and Analysis Services Tabular, you can create security roles in a data model so that each user only sees a subset of the data of certain tables. Such a restriction can be applied on one or more tables, but it propagates to other tables in the data model according to the properties of the relationships. As a result, the measure aggregates only the visible rows of the model, and a user cannot see the values of hidden rows in any way. This scenario is called Visual Totals: the aggregated measures only include data visible also in detail.
There are cases where you want to hide values of measures at certain levels of details, making their aggregated value visible at higher levels. In this case, you want to include the details that are hidden according to the security settings. This scenario is called Non Visual Totals, and it would be the default behavior of security roles in SQL Server Analysis Services (SSAS) Multidimensional. However, both Power BI and SSAS Tabular provide Visual Totals only in their implementation of security roles. You can implement Non Visual Totals in Power BI and SSAS Tabular leveraging on calculated tables and DAX.
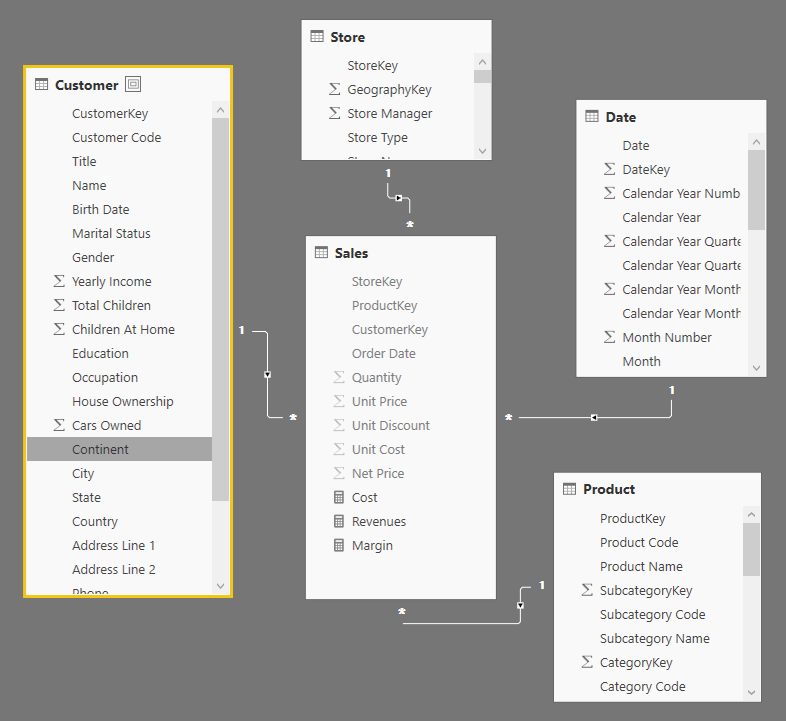
Consider the following data model, where the Customer table has a column Country, and you want to enable users to see the details of customers only for certain areas.
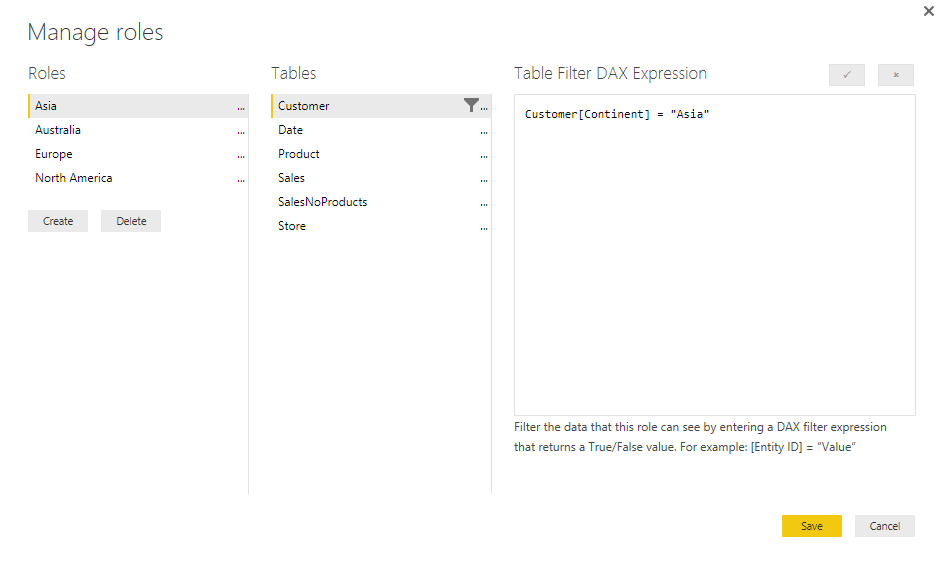
In our example, we create security roles that only shows customers from certain continents or countries, but you might have similar rules applied to other columns of the same table.
The following is the detailed list of security roles applied in this example.
| Role | Filter on Customer table |
|---|---|
| Asia | Customer[Continent] = “Asia” |
| Australia | Customer[Country] = “Australia” |
| Europe | Customer[Continent] = “Europe” |
| North America | Customer[Continent] = “North America” |
When you use an administrator user, you can see the following result, where the Total row corresponds to the sum of all the continents.
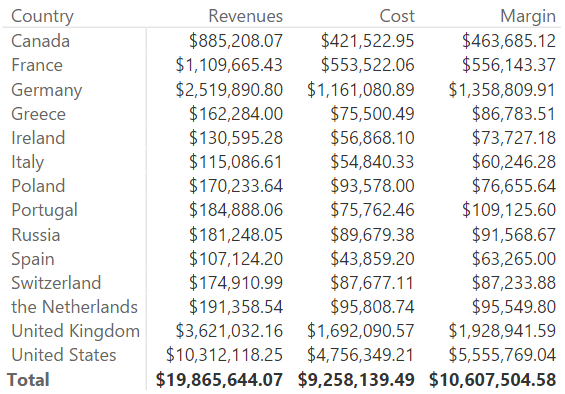
If you use a user belonging to both Europe and North America security roles, the same report will show the following result, where the Total row is different from the previous report and corresponds to the sum of the visible continents:
The last report shows Visual Totals. You can see the filter over the totals even if you create a reports using other attributes, such as the customer’s country visible in the following report.
If you want to display the Non Visual Totals, in the last two reports you would like to see in the Total row the sum of all the countries and continents, including those that are not visible, obtaining the same number of the Total row you have seen in the first report (which shows three continents, including Asia).
The initial definition of the measures that produces the Visual Totals is the following:
Sales[Cost] :=
SUMX ( Sales, Sales[Quantity] * Sales[Unit Cost] )

Sales[Revenues] :=
SUMX ( Sales, Sales[Quantity] * Sales[Net Price] )

Sales[Margin] :=
[Revenues] - [Cost]
In order to display Non Visual Totals, you have to store in a hidden table the aggregated values obtained ignoring the entity that is subject to security filters. In this example, you have to create a table that contains the values of Cost and Revenues measures aggregating all the customers by Product, Store, and Date. Such a table can be evaluated using a calculated table, which has access to all the rows of the Sales table because it is generated when you refresh the data model. You can define a SalesNoProducts table using the following expression:
SalesNoProducts =
SUMMARIZECOLUMNS (
    Sales[StoreKey],
    Sales[ProductKey],
    Sales[Order Date],
    "LineCost", [Internal Cost],
    "LineRevenues", [Internal Revenues]
)
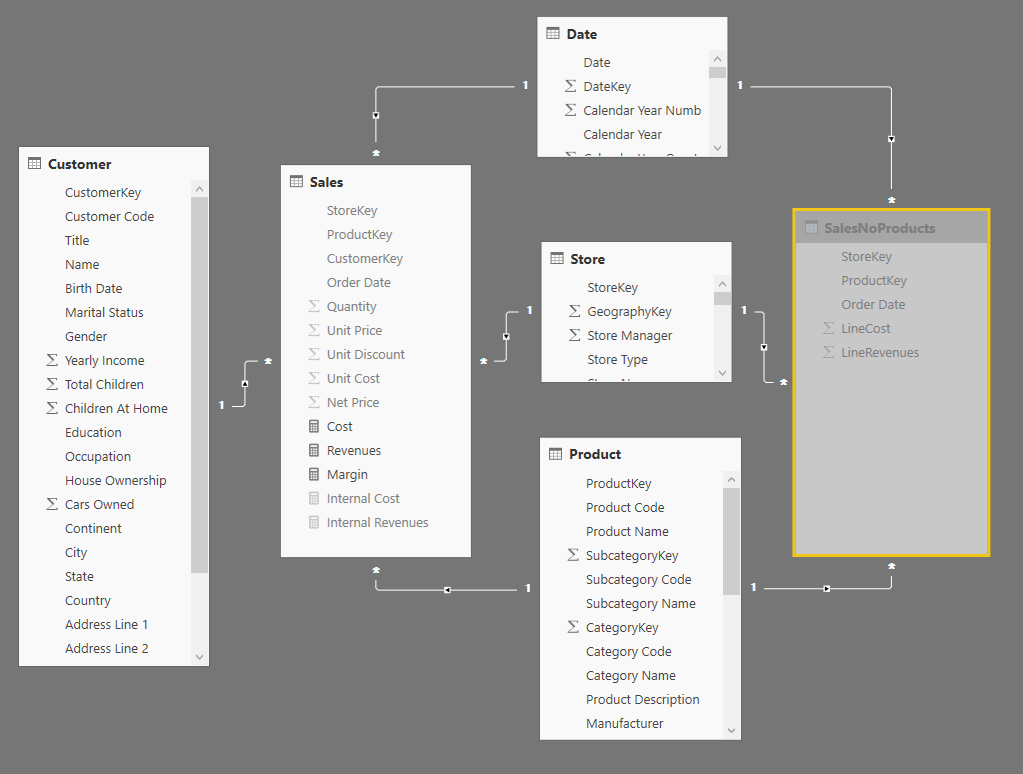
Such a table should be hidden in the data model, and connected to the Date, Store, and Product tables using single-filter direction relationships (bidirectional filters are a bad idea when you have multiple fact tables with shared dimensions in a data model). The following diagram shows the resulting data model.
At this point, you can rename the original Revenues and Cost measures in Internal Revenues and Internal Cost, respectively, and you can create new versions of Revenues and Cost that aggregates the table Sales if the Customer table has any filter, otherwise they aggregate SalesNoProducts when there are no filters over Customer, showing the total for all the customers including those that are not visible to the user.
Sales[Internal Cost] :=
SUMX ( Sales, Sales[Quantity] * Sales[Unit Cost] )

Sales[Internal Revenues] :=
SUMX ( Sales, Sales[Quantity] * Sales[Net Price] )

Sales[Revenues] :=
IF ( ISCROSSFILTERED( Customer ),
    [Internal Revenues],
    SUM ( SalesNoProducts[LineRevenues] )
)

Sales[Cost] :=
IF ( ISCROSSFILTERED( Customer ),
    [Internal Cost],
    SUM ( SalesNoProducts[LineCost] )
)
Using these new model and measures, any calculation that doesn’t filter any Customer will always display the total of all the customers as in the following example showing only details for Europe and North America, whereas the Total also include Asia.
The purpose of this is more visible by looking at the report by country, where you do not see any country from Asia, but you still see their value included in the Total row.
The goal of the Non Visual Totals is to hide the details of the customers excluded by security roles, without denying the visualization of their aggregated value. You can implement the same technique in any version of Analysis Services Tabular, even if for practical reasons the examples that you can download are provided in Power BI files (.pbix).
