Analyzing table and column size is an important step in optimizing a data model for Power Pivot, Power BI, or Analysis Services Tabular. This article describes VertiPaq Analyzer, an Excel workbook to analyze detailed information extracted from Dynamic Management Views.
IMPORTANT: the connection described article is valid for VertiPaq Analyzer v1 only. With VertiPaq Analyzer 2, only the section “Available Entities and Measures” is relevant. The connection technique is described in this article and in this free video course.
2017-01-15: the article has been updated to version 1.7 of VertiPaq Analyzer
2018-08-25: the article has been updated to clarify compatibility with version 1400 and Azure Analysis Services
2020-11-01: added measures included in version 2.0. You can also find videos in our VertiPaq Analyzer playlist on YouTube.
Analysis Services provides many Dynamic Management Views (DMV) to collect information about memory used by a data model. For example, DISCOVER_OBJECT_MEMORY_USAGE is a DMV that provides information about all the objects in memory. You can use such a DMV also to monitor a Multidimensional instance of Analysis Services. Kasper de Jonge created a sample model (BISM Memory Report) that organizes this data in a hierarchical way, making it easy to find the most expensive databases, tables, and columns on a server.
If you want to analyze a particular database, you probably want to look at more detailed information, which are available in other DMVs. However, manual access to individual DMVs is a time-consuming process, and the SQL language available for DMVs is very limited, not allowing groups and joins. For this reason, I created VertiPaq Analyzer, a Power Pivot data model to collect size information for all the objects in a specific database.
Starting with version 1.7, there are two versions of VertiPaq Analyzer included in the ZIP file you can download from http://www.sqlbi.com/tools/vertipaq-analyzer/:
- suffix 1103: this version is for Analysis Services (SSAS) tabular models in compatibility levels 1050/1100/1103. Any database in SSAS 2012/2014 has this compatibility level. In SSAS 2016 you can create models also in 1200 compatibility level, but you might still have legacy models.
- suffix 1200: this version if for Power BI Desktop models, and for SSAS models in compatibility level 1200 or higher. For example, the compatibility level 1400 is available in SSAS 2017 and Azure Analysis Services.
If you need to analyze a Power Pivot data model, you have two options:
- The easiest one is to import the Power Pivot model in Power BI Desktop, using the menu File \ Import \ Excel Workbook Contents. After the import, follow the instructions to connect to a Power BI Desktop model using the VertiPaq Analyzer model with suffix 1200.
- The alternative one is to use the import the Power Pivot model in Analysis Services using the Restore from PowerPivot feature in SQL Server Management Studio. After the import, follow the instruction to connect to SSAS Tabular using the VertiPaq Analyzer model with suffix 1103 (which is the compatibility model used by Power Pivot models – only Power BI performs an upgrade of the computability level during the import).
Connection with SSAS Tabular
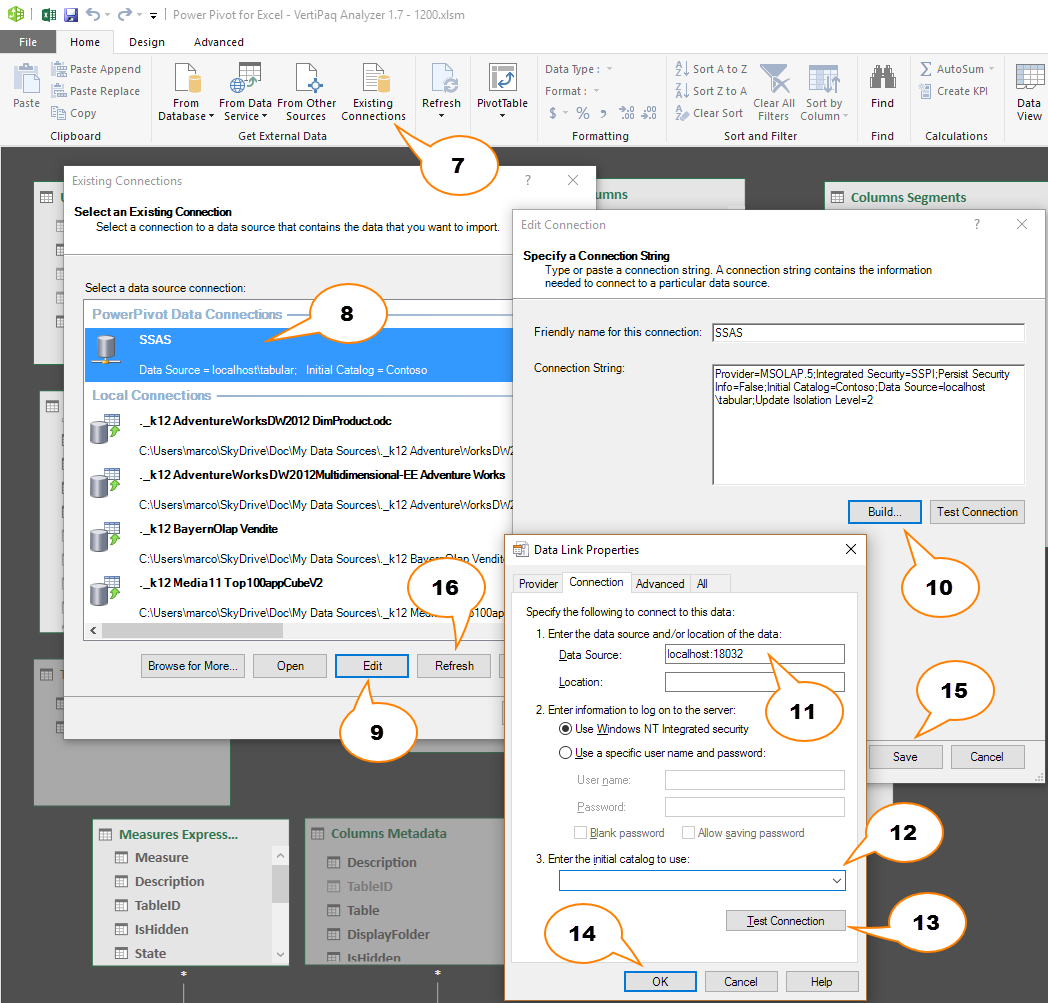
When you open the Excel file, you have to setup the connection to the database to monitor. After opening the Power Pivot window:
- Open Existing Connections
- Edit the SSAS connection
- Modify the instance name of Analysis Services (localhost\tabular in this example)
- Modify the database name (Contoso in this example)
- Test the connection (if it doesn’t work, check the connection string again)
- Save the connection
- Refresh the connection
Connection with Power BI Desktop
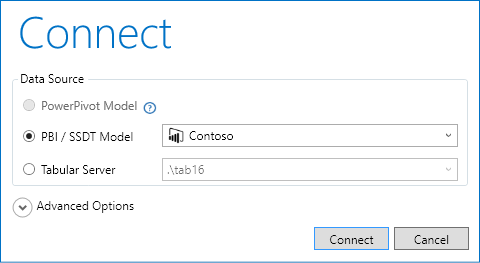
When you connect to Power BI Desktop, you have to keep the Power BI file application open. After you capture the connection port with DAX Studio, you use that connection as the instance name, and then you complete the connection in a similar way as you do for SSAS Tabular. This is the correct sequence:
- Open the model to analyze in Power BI Desktop (you can minimize the window, but the executable must be active for the entire session)
- Open DAX Studio
- Connect to Power BI Desktop from DAX Studio
![]()
- Retrieve the connection string in the lower-right corner of DAX Studio (localhost:<port number>)
![]()
- Open the VertiPaq Analyzer file (with suffix 1200) in Excel
- Open the Power Pivot for Excel window (go in Data ribbon, then click on Manage Data Model button)
- Click Existing Connections in the Home ribbon
- Select the SSAS item in the PowerPivot Data Connections
- Click Edit in the Existing Connections dialog box
- Click Build in the Edit Connection dialog box
- Insert the instance name of Analysis Services as Data Source (localhost:18032 in this example)
- Select the database name from the combo box (Enter initial catalog to use) – there should be a single unique name generated automatically by Power BI
- Click Test Connection (if you receive a Microsoft Data Link Error, click Yes and continue the test). The test is successful even if you receive the message “Test connection succeeded but some settings were not accepted by the provider”. Click OK to close the message after the test of the connection.
- Click OK to close the Data Link Properties dialog box.
- Click Save to close the Edit Connection dialog box.
- Click Refresh in the Existing Connections dialog box to refresh the data model in VertiPaq Analyzer
Sample Visualizations
The Excel file includes some pivot tables showing many useful information. The first is Tables, which displays table and column information in a hierarchical way.

The second is Columns, a detail of the information for the columns, regardless of the table. This visualization makes it easy to identify the most expensive columns in a database, regardless of the table they belong.

Then we have User Hierarchies, which is a detail of the cost of user hierarchies in each table.

The Relationships pivot table displays information about the size of the relationships associated to each table (on the foreign key side). In 1200 compatibility level the Relationships pivot table displays the names of the columns defining the relationships, and the cardinality of the two columns in the two related tables.

The Compression report is an example of the information you can display about compression applied to table and columns. This example is a recap of the distribution of the segments and their size across different compression types and encoding bits.

In 1200 compatibility level you have three new worksheets: Measures, Calc. Columns, and Calc. Tables. Each one has a list of the corresponding entities defined in the data model, displaying also the DAX expressions included in the definition. You can also format these expressions by using the Format DAX Expressions button in the VertiPaq Analyzer tab of the Excel ribbon.
Available Entities and Measures
The data model provides a number of measures:
- Cardinality: object’s cardinality (number of rows of a table or number of unique values of a column)
- Rows: number of rows of a table, partition, or segment
- Data Size: bytes for all the compressed data in segments and partitions. It does not include dictionary and column hierarchies.
- Columns Hierarchies Size: bytes of automatically generated hierarchies for columns (used by MDX).
- User Hierarchies Size: bytes of user-defined hierarchies
- Relationship Size: bytes of relationships between tables
- Columns Total Size: bytes of all the structures related to a column (sum of Data Size, Dictionary Size, and Columns Hierarchies Size)
- Dictionary Size: bytes of dictionary structures
- Table Size: bytes of a table (sum of Columns Total Size, User Hierarchies Size, and Relationships Size)
- Table Size %: ratio of Columns Total Size vs. Table Size
- Database Size %: ratio of Table Size vs. Database Size (sum of Table Size of all the tables)
- Segments #: number of segments
- Partitions #: number of partitions
- Columns #: number of columns
- Encoding_: encoding type of the columns (HASH/VALUE); shows Many for group of columns with different encoding
- RI Violations: number of relationships with referential integrity violations, assigned to the table on the one-side of the M:1 relationship; such table has an additional blank row
- Bid. Filters: number of relationships with bidirectional filter propagation
- MMR: number of many-to-many cardinality relationships
You can browse the data model using the following entities:
- Columns: includes Tables-Columns hierarchy (two levels, Table and Column), ColumnKey attribute (Table-Column as a single string, useful to browse columns regardless of the table they belong to)
- Columns Hierarchies: shows STRUCTURE_NAME with the name of the internal structure of a column hierarchy (usually ID_TO_POS and POS_TO_ID)
- Columns Segments: shows segments of columns in a table and includes a number of attributes:
- BitsCount
- BookmarkBitsCount
- CompressionType
- PartitionName
- SegmentNumber
- TablePartitionNumber
- VertipaqState
- Relationships: shows the relationships related to a table (RELATIONSHIP_ID is the only attribute, unfortunately it does not display the columns involved in the relationship); it cannot be crossed with columns and segments.
- User Hierarchies: shows hierarchies defined by user related to a table (cannot be crossed with columns and segments); it includes two attributes:
- STRUCTURE_NAME: name of the internal structure of a user hierarchy (usually CHILD_COUNT, FIRST_CHILD_POS, MULTILEVEL_ID, and PARENT_POS)
- User Hierarchy: name of the user-defined hierarchy
Internal Structure
The following picture shows the entities imported in the data model from the DMVs. You can see that collecting the information in a meaningful way requires seven different queries, resulting in measures having different granularities.
The Tables and Columns Cardinality tables are hidden and used by measures and calculated columns, in order to provide a more intuitive user experience navigating data in Pivot Tables.
Many calculated columns defined in the data model provides numeric information useful if you want to display the data as tables in Excel, without using a pivot table. You can find more information about the DMVs used in this data model, and on the meaning of certain columns and measures, in The Definitive Guide to DAX book.


