You can create static tables in DAX using the DATATABLE function. This article describes the syntax of this new feature and shows when and how to use it.
UPDATE 2018-04-10: DAX has now table constructors and the IN operator, described in another article. Some of the techniques described in this page are now obsolete.
Static Tables in Data Models
A static table has a fixed number of rows and columns and cannot be refreshed. Usually it is useful whenever you have a list of settings or parameters or values that will never change unless you will modify other parts of the data model and/or of DAX measures.
For example, you might have a table defining a list of segments, such as one you might use in a Static Segmentation:
| Price Range | Min Price | Max Price |
|---|---|---|
| Low | 0 | 10 |
| Medium | 10 | 100 |
| High | 100 | 9999999 |
Depending on the tool where you are using DAX, you have different options to create a static table.
Power Pivot
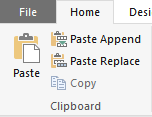
When you paste a table content from the clipboard, you create a new static table, or append data to an existing static table, or replace an existing static table. The data model stores the content of the table in its internal metadata. You cannot create a similar table in DAX. You can also use linked tables, but technically a linked table is a table connected to the underlying Excel workbook, so you can modify its content by modifying the Excel table.
Analysis Services Tabular 2012/2014 (compatibility level 1103)
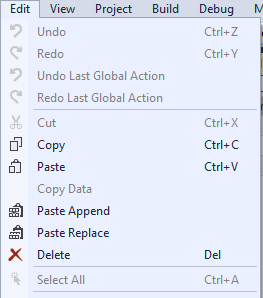
Similar to Power Pivot, you create a static table by pasting a table into the data model in Visual Studio. If you open the content of the .BIM file with a text editor, you will find that the XML file contains a DataSourceView section with the definition of the table and its content. This is the same technique used by Power Pivot.

Power BI Desktop
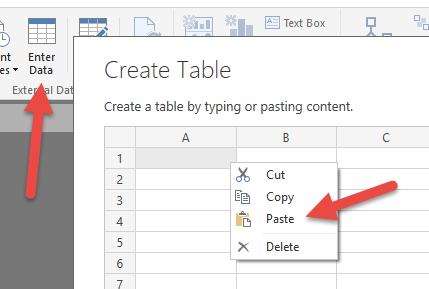
You have several options to create a static table in Power BI Desktop. First, you can use the Enter Data feature, which opens a dialog box where you insert data manually in a grid, and/or paste the content of a table from the clipboard using the Paste command.

In this case, the new table is embedded in the data model as a Power Query expression. Internally, the list of constant values is stored as an encoded compressed JSON document, resulting in the following M code:
Table.FromRows(
  Json.Document(
    Binary.Decompress(
      Binary.FromText(
        "i45W8skvV9JRMgBiQwOlWJ1oJd/UlMzSXAgfREBEPTLTM6BcHSVLCFCKjQUA",
        BinaryEncoding.Base64
      ),
      Compression.Deflate
    )
  )
…
This is the same technique used when you import in Power BI Desktop an Excel workbook containing a static table.
If you want to keep the data visible, you might use a calculated table with the union of different rows, such as the following expression:
Segments_UnionRows =
UNION (
    ROW ( "Price Range", "Low", "Min Price", CURRENCY ( 0 ), "Max Price", CURRENCY ( 10 ) ),
    ROW ( "Price Range", "Medium", "Min Price", 10, "Max Price", 100 ),
    ROW ( "Price Range", "High", "Min Price", 100, "Max Price", 9999999 )
)
Such a syntax is verbose, because you replicate the column names in each row, even if only the first one defined the column names in the output table. Moreover, you do not have a direct control over the data type of the columns, which are inferred by the expressions of the values included in the ROW syntax.
A better alternative is the new DATATABLE function, as in the following example:
Segments_Datatable =
DATATABLE (
    "Price Range", STRING,
    "Min Price", CURRENCY,
    "Max Price", CURRENCY,
    {
        { "Low", 0, 10 },
        { "Medium", 10, 100 },
        { "High", 100, 9999999 }
    }
)
Analysis Services Tabular 2016 (compatibility level 1200)
Currently (CTP 3.2) the Paste feature is not implemented in the new compatibility level of Analysis Services. This feature should be implemented before RTM, and we will update this article as soon as it will be available. Nevertheless, in CTP 3.2 you can already create a calculated table using the same DATATABLE syntax available in Power BI Desktop.
Syntax of DATATABLE
The syntax of DATATABLE function is the following:
DATATABLE (
    <column1_name>, <column1_datatype>,
    [ <column2_name>, <column2_datatype>,] […]
    {
        { <value1_row1> [, <value2_row1>] […] }
        [, { <value1_row2> [, <value2_row2>] […] }] […]
    }
)
The column_name is always a constant string and cannot be the result of an expression.
The column_datatype defines the data type of the column and can be one of the following names, followed by the corresponding data type in the Power BI Desktop user interface:
- BOOLEAN (True/False)
- CURRENCY (Fixed Decimal Number)
- DATETIME (Date/Time)
- DOUBLE (Decimal Number)
- INTEGER (Whole Number)
- STRING (Text)
After you defined all the columns, you provide a list of rows, embedded between curly brackets (braces). For each row, you provide a list of constant values embedded between another pair of braces. Only constant values are accepted in a list embedded within braces, you cannot use expressions in these values. For example, the following syntax is not valid because of the use of an expression in the third value of the first row:
    {
        { "Low", 0, 5 + 5 },
        { "Medium", 10, 100 },
        { "High", 100, 9999999 }
    }
If you create a column of DATETIME data type, you have to pass a string in the format “YYYY-MM-DD HH:MM:SS”. You can omit the date, the time or just the seconds, if you want. If you omit the date, it will be December 30, 1899 (which is the zero date in DAX). If you omit the time, it is midnight (which is the zero time in DAX).
For example, the following expression returns a table with start and end date of quarters in year 2015.
Quarters2015 =
DATATABLE (
    "Quarter", STRING,
    "StartDate", DATETIME,
    "EndDate", DATETIME,
    {
        { "Q1", "2015-01-01", "2015-03-31" },
        { "Q2", "2015-04-01", "2015-06-30" },
        { "Q3", "2015-07-01", "2015-09-30" },
        { "Q4", "2015-010-01", "2015-12-31" }
    }
)
Use Cases and Future Directions
The common use case of DATATABLE is creating a static table in a data model, using a full DAX syntax that you can read and modify if necessary. A possible use case is an alternative syntax to a comparison with a list of values, even if it is not ideal unless you have a very long list of values.
For example, consider the following DAX query that retrieves the customers from Italy, Greece, and Spain:
EVALUATE
FILTER (
    Customer,
    Customer[CountryRegion] = "Italy"
    || Customer[CountryRegion] = "Greece"
    || Customer[CountryRegion] = "Spain"
)
You can rewrite the same syntax using a DATATABLE in the following way:
EVALUATE
FILTER (
    Customer,
    CONTAINS (
        DATATABLE (
            "CountryRegion", STRING,
            { { "Italy" }, { "Greece" }, { "Spain" } }
        ),
        [CountryRegion],
        Customer[CountryRegion]
    )
)
Even if it seems more verbose, such a syntax could be shorter in case you have a longer list of names to include in the filter. However, the current query plan generated using DATATABLE is much slower than the one obtained using the first syntax, based on a standard OR operator. This could be improved in future release, but currently it is not a good idea to use DATATABLE to apply a filter over a list of values.
My personal hope is that the braces-based syntax introduced in DAX by DATATABLE will be used in the future to implement something similar to the IN operator available in SQL. I would like to write the following DAX expression:
UPDATE 2018-04-10: The following code is now supported in DAX. For more information read The IN operator in DAX.
EVALUATE
FILTER (
    Customer,
    Customer[CountryRegion] IN { "Italy", "Greece", "Spain" }
)